Plasticity Simulation Example
This notebook demonstrates how to simulate plasticity in single-cell data using the PLASTRO package. We’ll walk through different types of plasticity simulations including random walk plasticity and cluster-based plasticity switches.
Overview
The PLASTRO package provides tools to:
Generate simulated single-cell phenotypic data
Simulate lineage tracing with CRISPR mutations
Introduce different types of cellular plasticity
Analyze the effects of plasticity on phenotypic and lineage relationships
[40]:
# Import required libraries
import os
import numpy as np
import pandas as pd
import matplotlib.pyplot as plt
import seaborn as sns

from anndata import AnnData
import scanpy as sc

# Import PLASTRO package
import plastro
[41]:
# Set up plotting parameters
plt.rcParams['figure.figsize'] = (8, 6)
plt.rcParams['figure.dpi'] = 100
sns.set_style('whitegrid')
sc.settings.verbosity = 1  # verbosity level
1. Generate Simulated Single-Cell Data
1a. Phenotypic data
First, we’ll create simulated single-cell data with a branching structure that mimics cellular differentiation trajectories.
[42]:
# Parameters for simulation
n_leaves = 8  # Number of terminal cell types
sample_res = 50  # Number of cells per branch
n_dim = 20  # Number of phenotypic dimensions

# Create results directory
results_dir = 'plasticity_example_results'
os.makedirs(results_dir, exist_ok=True)

print(f"Generating simulated data with {n_leaves} cell types, {sample_res} cells per type, {n_dim} dimensions")
Generating simulated data with 8 cell types, 50 cells per type, 20 dimensions
[43]:
# Generate the branching structure and simulated data
# Use PLASTRO's built-in simulation functions

print("Using PLASTRO simulation functions...")

# Create a random binary tree structure
sample_structure = plastro.create_random_binary_tree(n_leaves, sample_res)
full_simulated_ad = plastro.generate_ad(sample_structure, n_dim)

print(f"Created simulated data with {full_simulated_ad.n_obs} cells and {full_simulated_ad.n_vars} features")
print(f"Number of branches: {len(full_simulated_ad.obs['branch'].unique())}")
print(f"Number of leiden clusters: {len(full_simulated_ad.obs['leiden'].unique())}")
Using PLASTRO simulation functions...
Created simulated data with 3850 cells and 20 features
Number of branches: 15
Number of leiden clusters: 16
[44]:
# Visualize the simulated data
sc.pl.umap(full_simulated_ad, color='branch', legend_loc='on data',
           title='Simulated Single-Cell Data', size=30)

[45]:
ad = plastro.subset_to_terminal_branches(full_simulated_ad, show_plots=True)
# TODO: Optionally you can sample based on pseudotime (preferentially sample terminal states with some temperature control)
print('Keeping {} cells from terminal branches'.format(ad.n_obs))

Selected 8 terminal branches:
  b-0-0-0: 500 cells
  b-0-0-1-0: 150 cells
  b-0-0-1-1: 50 cells
  b-0-1: 300 cells
  b-1-0-0: 50 cells
  b-1-0-1-0: 500 cells
  b-1-0-1-1: 500 cells
  b-1-1: 400 cells
Keeping 2450 cells from terminal branches
1b. Lineage Tracing
Next, we introduce lineage tracing data onto the branching process using the Cassiopeia CRISPR/Cas9 simulator.
[46]:
cass_tree = plastro.simulate_lineage_tracing(full_simulated_ad, ad, 'X_dc', save_to=results_dir)
Starting neighbor-joining with 2451 taxa using scikit-bio
Tree rooted with outgroup: Cell_5
Neighbor-joining completed successfully
Saved tree to plasticity_example_results/simulated_tree.nwk
[47]:
# Save the character matrix with CRISPR mutations
character_matrix = cass_tree.character_matrix
assert set(character_matrix.index) == set(ad.obs_names), 'Character matrix and terminal ad obs_names do not match'

# Save the character matrix
character_matrix.to_csv(os.path.join(results_dir, 'character_matrix.csv'))
[51]:
from scipy.spatial.distance import pdist, squareform
# Replace -1 with nan
character_matrix = character_matrix.replace(-1, np.nan)
# Use Hamming distance to roughly approximate phylogenetic distance
phylogenetic_distances = pdist(character_matrix.values, metric='hamming')
phylogenetic_distances = squareform(phylogenetic_distances)
phylogenetic_distances = pd.DataFrame(phylogenetic_distances, index=character_matrix.index, columns=character_matrix.index)
2. Random Walk Plasticity Simulation
Random walk plasticity simulates cells transitioning through phenotypic space via random walks on a connectivity graph. Cells can move from their original phenotype to distant phenotypes through intermediate states.
[52]:
# Let's visualize the cell states/ leiden clusters of the cells in our final dataset
sc.pl.umap(ad, color='leiden', title='Leiden Clusters', size=40,
            frameon=False,
           edges=True,
           edges_color='black')
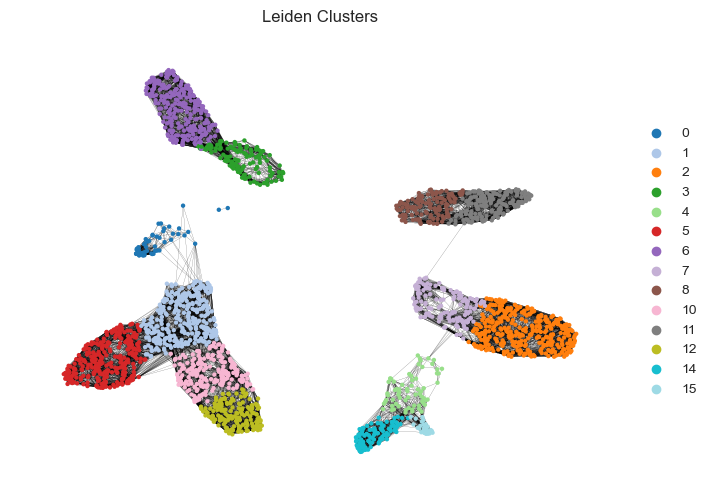
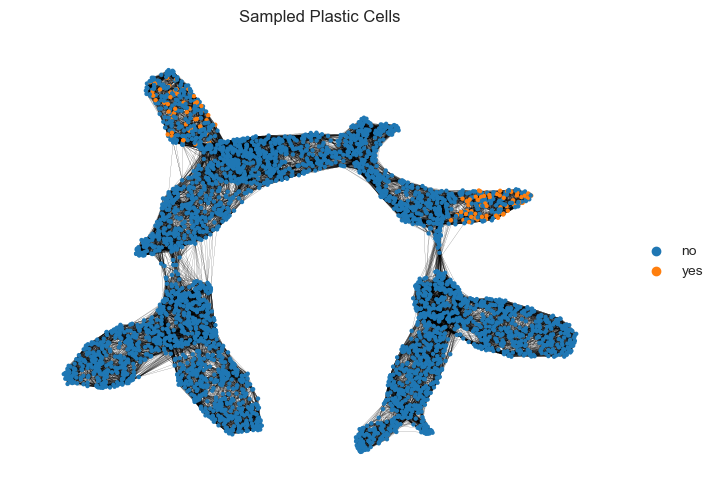
We will choose a leiden cluster to be “plastic”. We will choose a specific number of cells from this cluster to undergo random walks of a specified length. This random walk will allow us to model potential de-differentiation and trans-differentiation processes, as the cell will take on the phenotype of the cell at the end of its random walk on the phenotypic manifold
[53]:
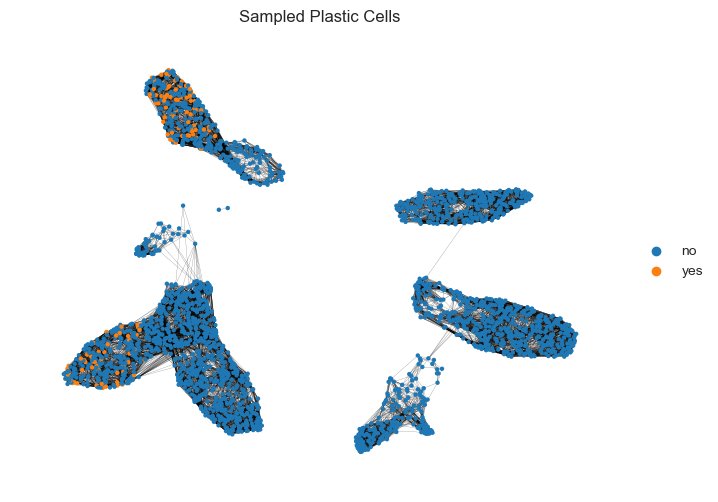
# Optionally, we can do this for more than one cluster
proportion_plastic = {6: 0.3, 5: 0.2}
plastic_cells = {}
for lc in proportion_plastic.keys():
    cluster_cells = ad.obs_names[ad.obs['leiden'] == str(lc)].to_list()
    n_plastic = int(len(cluster_cells) * proportion_plastic.get(lc, 0))
    selected_cells = np.random.choice(cluster_cells, n_plastic, replace=False).tolist()
    plastic_cells[lc] = selected_cells
    print(f"Selected {n_plastic} plastic cells from leiden cluster {lc}")

all_plastic_cells_random_walk = [cell for cells in plastic_cells.values() for cell in cells]
ad.obs['Will Change Phenotype'] = ['yes' if cell in all_plastic_cells_random_walk else 'no' for cell in ad.obs_names]
sc.pl.umap(ad, color=['Will Change Phenotype'], title=['Sampled Plastic Cells'], size=40,
            frameon=False,
           edges=True,
           edges_color='black')

plt.show()

# We will choose the random walk to be of length 500 and 1000 for the two clusters
walk_lengths = {6: 500, 5: 1000}
plastic_walk_ad = plastro.random_walk_plasticity(full_simulated_ad, ad, plastic_cells, walk_lengths)
Selected 81 plastic cells from leiden cluster 6
Selected 57 plastic cells from leiden cluster 5
Leiden cluster 6: 81 plastic cells will perform random walks of length 500
Random walks - T=0.06s
Leiden cluster 5: 57 plastic cells will perform random walks of length 1000
Random walks - T=0.11s
/Users/spersad/.local/share/mamba/envs/plastro_env/lib/python3.11/site-packages/anndata/_core/anndata.py:1791: UserWarning: Observation names are not unique. To make them unique, call `.obs_names_make_unique`.
  utils.warn_names_duplicates("obs")
/Users/spersad/Documents/PLASTRO/plastro/plasticity.py:128: ImplicitModificationWarning: Trying to modify attribute `.obs` of view, initializing view as actual.
  final_ad.obs['change_in_phenotype'] = change_distances
We can now visualize the updated phenotypes of cells that performed random walks. We may observe de-differentiation, as they return to more ancestral states, as well as trans-differentiation, where they change phenotype to match those in other terminal cell states.
[54]:
sc.pp.neighbors(plastic_walk_ad)
plastro.plot_change_in_phenotype(ad, plastic_walk_ad, all_plastic_cells_random_walk, show_plots=True, save_to=os.path.join(results_dir, 'random_walk_phenotype_change.png'))

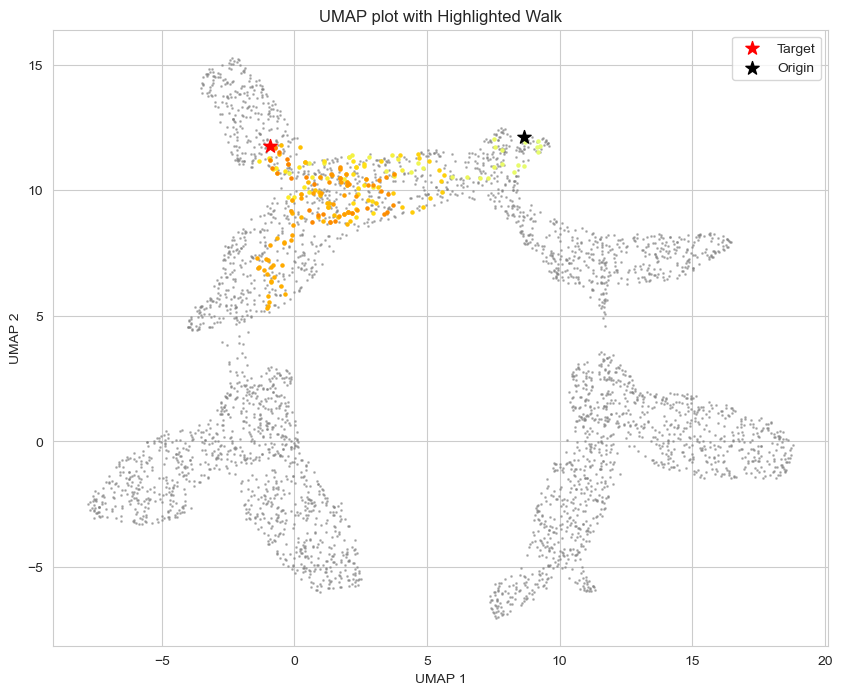
2b. Visualizing Individual Random Walks
Let’s examine specific examples of random walks to understand how cells transition through phenotypic space.
[55]:
# Perform a single random walk for visualization
target_cells = [full_simulated_ad.obs_names[10]]  # Choose a specific cell
walk_length = 200

print(f"Performing random walk from cell: {target_cells[0]}")
print(f"Walk length: {walk_length}")

# Perform the walk
targets, change_in_phenotype, walk_indices = plastro.perform_random_walk(
    full_simulated_ad,
    plastic_cells=target_cells,
    walk_length=walk_length
)

print(f"Walk ended at cell: {targets.loc[target_cells[0], 'target']}")
print(f"Phenotypic change: {change_in_phenotype.loc[target_cells[0], 'change_in_phenotype']}")

# Visualize the random walk path
plastro.visualize_walk(full_simulated_ad, walk_indices[0], show_plots=True)
plt.show()
Performing random walk from cell: Cell_10
Walk length: 200
Random walks - T=0.03s
Walk ended at cell: Cell_3787
Phenotypic change: 14
3. Leiden Cluster Switch Plasticity
This type of plasticity simulates discrete switches between phenotypic clusters. Cells from an origin cluster directly adopt the phenotype of cells from target clusters, mimicking a trans-differentiation process (or de-differentiation if we select transitions to ancestral states). First we must decide which clusters we want to change to which clusters.
[57]:
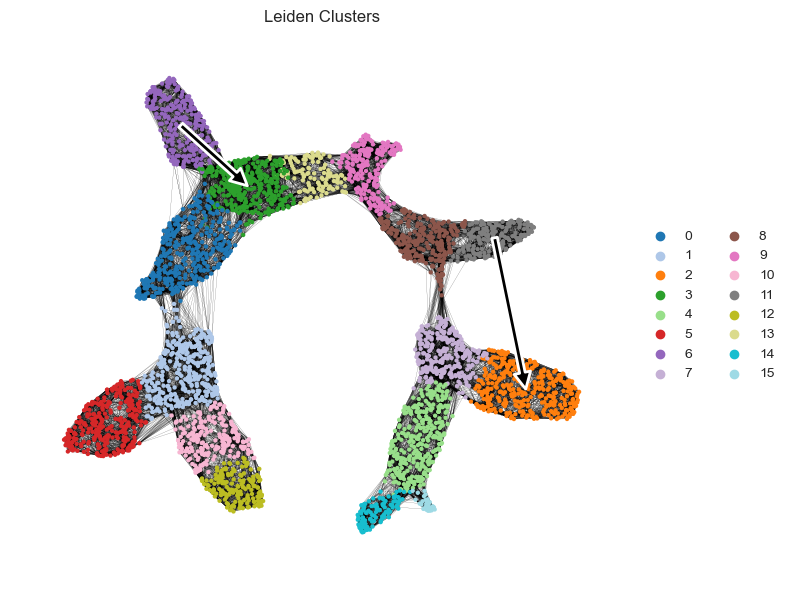
# Let's visualize the cell states/ leiden clusters of the cells in our FULL dataset. We will choose from this the source, and target leiden clusters for our cell transitions
sc.pl.umap(full_simulated_ad, color='leiden', title='Leiden Clusters', size=40,
            frameon=False,
           edges=True,
           edges_color='black')

We will choose some clusters to de-differentiation and trans-differentiate. This will need to be changed depending on the simulated data
[59]:
destination_clusters = {
    '11': {'destination': '2', 'proportion': 0.4},
    '6': {'destination': '3', 'proportion': 0.2}
}

assert set(destination_clusters.keys()) - set(ad.obs['leiden'].unique()) == set(), f"Source clusters must be in the data. Choose from {set(ad.obs['leiden'].unique())}"
# We can also visualize these changes on UMAP
plastro.plot_leiden_transitions(full_simulated_ad, destination_clusters)
[60]:
# Now we will sample the cells from the source clusters that will switch to the target clusters.
# !WARNING: If there are too few cells in the target cluster, we will limit the proportion of cells that can switch to that cluster
plastic_cells = {}
for source, info in destination_clusters.items():
    dest = info['destination']
    prop = info['proportion']

    source_cells = ad.obs_names[ad.obs['leiden'] == source].to_list()
    n_plastic = int(len(source_cells) * prop)

    if n_plastic == 0:
        print(f"Warning: No cells selected for leiden cluster {source} with proportion {prop}. Skipping.")
        continue

    dest_cells = ad.obs_names[ad.obs['leiden'] == dest].to_list()
    if len(dest_cells) < n_plastic:
        n_plastic = len(dest_cells)
        print(f"Warning: Not enough cells in target cluster {dest}. Limiting number of plastic cells to {n_plastic}.")

    selected_cells = np.random.choice(source_cells, n_plastic, replace=False).tolist()
    plastic_cells[source] = {'destination': dest, 'cells': selected_cells}
    print(f"Selected {n_plastic} plastic cells from leiden cluster {source} to switch to cluster {dest}")

all_plastic_cells_leiden = sum([plastic_cells[cl]['cells'] for cl in plastic_cells], [])
full_simulated_ad.obs['Will Change Phenotype'] = ['yes' if cell in all_plastic_cells_leiden else 'no' for cell in full_simulated_ad.obs_names]
sc.pl.umap(full_simulated_ad, color=['Will Change Phenotype'], title=['Sampled Plastic Cells'], size=40,
            frameon=False,
           edges=True,
           edges_color='black')

plt.show()

plastic_leiden_ad = plastro.cluster_switch_plasticity(full_simulated_ad, ad, plastic_cells, column='leiden')
Selected 69 plastic cells from leiden cluster 11 to switch to cluster 2
Selected 54 plastic cells from leiden cluster 6 to switch to cluster 3
/Users/spersad/Documents/PLASTRO/plastro/plasticity.py:486: ImplicitModificationWarning: Trying to modify attribute `.obs` of view, initializing view as actual.
  final_ad.obs['change_in_phenotype'] = change_distances
[66]:
sc.pp.neighbors(plastic_leiden_ad)
plastro.plot_change_in_phenotype(ad, plastic_leiden_ad, all_plastic_cells_leiden, show_plots=True, save_to=os.path.join(results_dir, 'leiden_phenotype_change.png'))

5. Summary and Export Results
Let’s summarize our plasticity simulation results and save the key outputs.
[67]:
# Save the main annData objects
full_simulated_ad.write(os.path.join(results_dir, 'full_simulated_data.h5ad'))
ad.write(os.path.join(results_dir, 'original_data.h5ad'))
plastic_walk_ad.write(os.path.join(results_dir, 'random_walk_plasticity.h5ad'))
plastic_leiden_ad.write(os.path.join(results_dir, 'leiden_switch_plasticity.h5ad'))
print("Saved simulation results to:")
print(f"- Full simulated data: {os.path.join(results_dir, 'full_simulated_data.h5ad')}")
print(f"- Original data: {os.path.join(results_dir, 'original_data.h5ad')}")
print(f"- Random walk plasticity: {os.path.join(results_dir, 'random_walk_plasticity.h5ad')}")
print(f"- Leiden switch plasticity: {os.path.join(results_dir, 'leiden_switch_plasticity.h5ad')}")
Saved simulation results to:
- Full simulated data: plasticity_example_results/full_simulated_data.h5ad
- Original data: plasticity_example_results/original_data.h5ad
- Random walk plasticity: plasticity_example_results/random_walk_plasticity.h5ad
- Leiden switch plasticity: plasticity_example_results/leiden_switch_plasticity.h5ad
Next Steps
Explore the plastro_overlap_analysis notebook to see how we can measure single-cell plasticity values for this simulated data.